A Beginner's Guide to Reading UK Company Earnings Reports
Most UK listed companies publish results twice a year: a full annual report and a half-year update. Both arrive as documents of eighty pages or more, and both are written by people who would quite like you to reach a particular conclusion. The skill is to read the numbers first and the narrative second. That order matters more than any single ratio.
What follows covers what sits inside a UK annual or interim report, which figures deserve your attention, and the patterns that tend to appear a year or two before trouble becomes obvious.
Annual accounts, interim results and trading updates
These are different documents and should not be read as though they were interchangeable.
- Annual report and accounts. Covers the full financial year, is audited by an independent firm, and is filed at Companies House. Most Main Market and AIM companies publish within three to four months of their year end.
- Interim (half-year) results. Cover six months, are usually reviewed rather than audited, and carry far less detail. The balance sheet and cash flow statement are often condensed to the point of being unhelpful.
- Trading updates. Short statements from the board, sometimes with no profit figure at all. Useful for timing, rarely useful for analysis.
Check the year-end date before comparing anything. A retailer with a January year end and a software business with a December year end are not reporting on the same trading period, and seasonal companies look dramatically different at the half-year.
The four statements that actually matter
Skip the photography and the chairman's smile. Find these four.
The income statement takes you from revenue down to profit, passing through cost of sales, administrative expenses, finance costs and tax. It is the most quoted statement and the easiest to flatter.
The statement of financial position — what most of us still call the balance sheet — is a snapshot at a single date: what the company owns, what it owes, and what is left for shareholders. Read it alongside the previous year, not on its own.
The cash flow statement is the hardest of the three to dress up. Profit is an accounting opinion; cash arriving in the bank is closer to a fact. If a company reports rising profits and shrinking operating cash flow year after year, believe the cash.
The notes are where the interesting things hide: accounting policies, debt maturity dates, lease commitments, pension obligations, contingent liabilities and related-party transactions. Nobody reads them for pleasure. Read them anyway.
The front half: prose with a purpose
The strategic report, the chair's statement and the chief executive's review explain performance and set out strategy. They are worth reading, but read them knowing what to look for. The first thing to check is the gap between statutory figures and adjusted ones.
Companies routinely present adjusted profit, adjusted EBITDA or underlying earnings that strip out items management considers exceptional. Sometimes that is legitimate — a genuine one-off legal settlement, say. Sometimes "exceptional" appears in four consecutive annual reports, which tells you restructuring is simply part of the cost base. Ask yourself what the statutory number is, and why the gap exists.
Then read the auditor's report. Look for a modified opinion, an emphasis of matter paragraph, or any mention of a material uncertainty relating to going concern. Auditors are cautious by nature, so when they flag something, take it seriously. A change of auditor, or a resignation mid-year, also deserves a closer look.
Six ratios worth calculating yourself
You do not need a spreadsheet model. These will do most of the work.
- Gross margin: gross profit divided by revenue. Falling margins usually mean pricing pressure or rising input costs.
- Operating margin: operating profit divided by revenue. Watch the trend, not the level — a 12 per cent margin falling to 8 per cent over three years is the story.
- Return on capital employed: operating profit divided by total assets less current liabilities. It tells you whether the business earns a decent return on the money tied up in it.
- Net debt to EBITDA: total borrowings less cash, divided by operating profit before depreciation and amortisation. Lenders watch this closely, because it is often a loan covenant.
- Interest cover: operating profit divided by finance costs. Below roughly three times, a wobble in trading starts to threaten the dividend and the debt.
- Cash conversion: operating cash flow divided by operating profit. Persistently below 100 per cent means reported profit is not turning into money.
Working capital days are worth adding: how long customers take to pay, how long stock sits on the shelf, and how long the company takes to pay suppliers. All three are in the notes.
Warning signs to watch for
- Trade receivables or inventory growing much faster than revenue. Someone is either selling on generous terms or struggling to collect.
- Debt rising while profits stand still, particularly if the dividend is still being paid.
- Exceptional items appearing every year, or "one-off" costs that recur under a fresh label.
- A large pension deficit, or lease and off-balance-sheet commitments that only appear deep in the notes.
- A change in accounting policy or estimate that conveniently improves profit.
- Related-party transactions, loans to directors, or a complicated group structure that resists explanation.
- Vague language about covenant headroom, refinancing timelines, or "constructive discussions" with lenders.
- Late filing at Companies House, a delay to results, or a restatement of previous figures.
Reading one in twenty minutes
- Open the cash flow statement. Check operating cash flow against operating profit.
- Compare revenue growth with growth in receivables and inventory.
- Read the auditor's report and the going concern note.
- Skim the accounting policies for anything that has changed.
- Find net debt, the maturity profile and any stated covenant.
- Only then read the chief executive's review — by now you will spot what it is not saying.
Turning it into a habit
Keep a single page per company. Note the year-end date, revenue, operating margin, net debt, cash conversion and one sentence on anything that changed. Do that for two or three reporting periods and you will build a sense of how a business behaves that no summary article can give you.
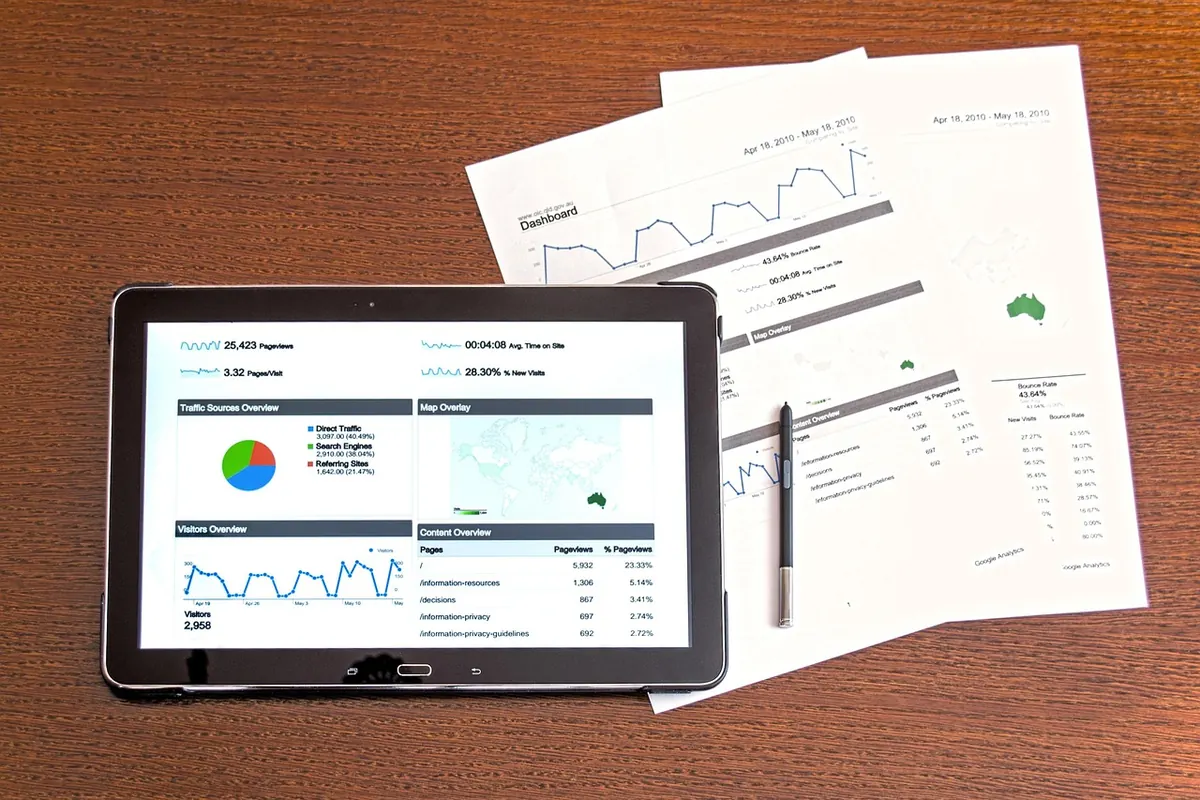
Company reports are dense, but they are also consistent: the same sections, the same ratios, the same handful of places where problems surface first. Once you know the layout, reading one is less like homework and more like checking a familiar dashboard.
This is general information about how to read published accounts, not investment advice. If you are making decisions about your own money, or about lending to or investing in a business, speak to a qualified accountant or regulated financial adviser who can look at the full picture.
Photo: Pexels / Pixabay


You Might Also Like
A plain-English guide to how UK business rates are worked out, which reliefs can cut your bill, and how to challenge a valuation you think is wrong.
A practical guide to setting up bookkeeping for a UK small business: choosing the right software, recording VAT correctly, and keeping Making Tax Digital-compliant records without the overwhelm.